As a part of UWB, the IAS Program has five representing skills as a part of every major:
Collaboration and Shared Leadership
Critical and Creative Thinking
Diversity and Equity
Interdisciplinary Research and Inquiry
Writing and Communication
The Mathematical Thinking and Visualization major also features these representing skills:
Addressing Real-World Quantitative Concerns
Visual Representations of Problems and Data
Collaboration and Shared Leadership
The biggest testament to Collaboration and Shared Leadership is the short film I made for BMCS 472, Global Media Lab.
For this course, we were charged with making a short film, which was screened at the
Local Sightings Film Festival
in Seattle, and at the
Tacoma Film Festival
in 2022.
The shared vision that comes with collaboration cumulates in a final project or product that's greater than
the sum of its parts. We each had something different to bring to the table, and everyone has their own unique way of
contributing, being part of a production crew during the pre-production, production, and post-production phases of
Global Media Lab.
Each member was a part of a different department. We had our On-Camera Talent, Camera Crew, Art Department, Producers, and Editors.
Even with these defined departments, our work would have us bleed through different departments.
During the process of producing this film, I was responsible for Hair and Makeup, and for creating the Music Score for the film.
During pre-production, I was working with the Art Department. We were taksed with creating elements for our set designs, costumes, and makeup.
I was in charge of Hair and Makeup, alongside one other member. We had many different materials available to us, and through our many tests,
ended up with a combination of Ben Nye white face paint, and a slurry of flour, water, and food dyes to bring out our desired plant-like texture.
Production day was more than just filming. As a Hair and Makeup artist, my duties were to get our On-Camera talent ready for filming.
We had a handful of hours to get all our filming done, and so it was a stressful time. We had six dancers to get hair and makeup ready for,
and not a lot of time to do so. I was travelling side-by-side with our On-Camera talent, making sure that between each scene, they looked
and felt like a part of the whole scene, as a part of our larger-than life story.
Post-Production was my largest job. I was in charge of scoring the short film. I was responsible for composing and recording many of the
audio elements that are present within the short film. This led to many stressful hours of constant revising, composing, re-composing,
recording, and editing to make sure that we had our best music accompaniment for our visuals. We worked until the last possible day to
get our final version ready for release.
Critical and Creative Thinking
Critical and Creative Thinking is a requirement when designing software processes. In order to create an effective and robust software
design, a large portion of the work required takes place in the planning phase. For CSS 452, Game Engine Development, Critical and Creative
Thinking came in great use when designing our unique functionality. During the conceptualization, planning, and development phases of this
project, this line of thinking was required in order to make a functional engine.
Designers: Ani Rao, Mikhail Ermolenko, Trevor Nguyen.
Creative Thinking came into effect during our conceptual stage. Our first task during the project was to select a unique functionality
to implement within an OpenGL Game Engine the class was developing. There were many different options to choose from, as the engine we
were working with was a very rudimentary one, with the minimum functionality required. In the process of choosing our design, we decided
to collectively decide based on our own experiences with gaming. One common thread we found within our experiences was that many of the
games we had experience with utilized a tiled system of designing levels and maps. Where a lot of other groups chose to include functionality
for physics, particle, or user-input functionality, our group took the unique approach of designing our Tile-Based Map Editor.
In drafting our design during the planning stage, I analyzed the different parts of the engine which we already had available to us, and selected
the files that were necessary in order to implement our design in the source code: Our Tiles would be built from TextureRenderable objects,
which would be stored in a MapGrid class as part of our game's scene. Without taking the time to think critically about what we needed to use,
our system would have undoubtedly fail.
For a project that required an intense amount of planning and time spent on the specifications, the diagram looks deceptively simple. However, this
framework of organizing our system was incredibly useful during the development stage.
During our development stage, as with any intensive software design, encountering bugs in software is an inevitability. Thinking critically about our
progress was an essential factor in fixing any faulty code. Designing our code with traceability is a huge part of being able to fix bugs. In events
where one pair of eyes is not enough, it's essential for other members of our team to be able to examine the code in order to find a solution. Thinking
ahead in the program's design makes it much easier for the team to fix problems we encountered during this stage.
Diversity and Equity
CSS 350, Management Principles for Computing Professionals, is an important resource into Diversity and Equity skills. For anyone wishing to
work as a Project Manager or to lead a team, one of the important things that we learned was different ways to collaborate, based on the different
perspectives that each member brought to the table. Within the course, we rotated as team managers as we worked through different tasks. As part of
our research during this course, we assessed methods of generating Creativity and Innovation in the workplace. Researching the management of work
items and the playfulness of the work are important in analyzing what makes a diverse and effective workplace.
Work organization is a huge part of what generates a diverse structure. Openness in communication is a key to ensuring that the perspectives provided
in completing work tasks is a welcome process for every member. This is why the Agile method of development is one such organization structure which
promotes a more diverse environment. It's a fast-paced structure that encourages "sprints" that aim to complete a single task within a fixed set of
time. Because of these conditions, frequent communication between members of the team handling a set of tasks is a necessary component in being able
to effectively deliver on the work items. By creating an environment of openness between team members, opinions become more diverse.
Play and Constraints are a big factor in terms of getting diverse positions from the workforce. If everyone is able to have fun with their
labor, then everyone will be comfortable enough to participate in decision-making. Constraints, however, in thinkgs like time, resources,
rules and oversight, and output parameters all play a factor in keeping the solutions realistic. Striking the right balance between Play and
Constraints is an important part of gaining effective opinions from a diverse set of people in the workplace. Making sure everyone takes the
work seriously and can offer their opinion is a big part of getting diverse ideas.
From our research, we found that encouraging Creativity in the workplace required a welcoming environment that is supportive of multiple different
perspectives, world views, and backgrounds. The ways that workers are organized through the workplace contribute to the environment within a job,
and therefore, we concluded that a diverse and open environment creates conditions that encourage creativity and innovation in the workplace.
Interdisciplinary Research and Inquiry
One of the different places that Interdisciplinary Research is required is in the greater scheme of developing the product
within the workplace. In the CSS 474 Product Development Lab, this environment is simulated within the course of the 10-week
quarter by having us work with professional clients like Justin Saul to develop a prototype we can pitch to their business.
This project had our entire team working through multiple development stages that required an Interdisciplinary approach,
from working on app UI, developing the visual assets into a functional program, and presenting our prototype to the clients.
The first aspect of developing our prototype was to gain a visual understanding of the product. We were tasked with creating
wireframes for a mobile app designed to assist in senior caregiving. Not only is an understanding of visual elements required,
an understanding of the customers' use cases elicits our prototype's functional requirements. We then took into account what both
our customers and our user personas would need from the app, and derived a simple layout for the needs we aimed to address.
Only after we determined the structure of our prototype's elements, did we decide to work on visual elements such as the color
palette, shapes, icons, and other elements. With constant contact with our client, we created many different wireframes before
selecting our final design.
The second arm of our Interdisciplinary Research within this project came from taking our wireframes and converting them into
a minimum viable prototype. We used Bubble, an app development platform, in order to design our product. No one on our team had
worked with this platform before, and so our members required specific training with its different uses. Members would research
how to utilize different containers, conform to style-guides set by the visual department, and be able to direct users to fulfill
the needs by connecting each frame via different links, buttons, or other elements on the screen. Our research was shared with our
peers in order to ensure that everyone was on the team was in sync around how to use the tools at our disposal.
The final skill we utilized as a part of this course was the ability to present our pitch to the clients at the end of the quarter.
Different elements went into our pitch, utilizing prior research, such as User Personas and "pain-points" identified to address our
customer needs, performing market analysis to illustrate the unique value-add of our product, and most importantly, showcasing the
prototype. This skill was important to showcase how the previous skills accumulated would contribute to a successful pitch and product.
The Product Development Lab, as a CSS and Business course, is at the core of Interdisciplinary Research and Inquiry. It combines the
skillsets of two vastly different programs within the UW Bothell experience, and show how the many different skills that it takes to
create a successful product come together.
Writing and Communication
Writing and Communication is an essential part of any workplace, and being able to document the framework of a software product is an
extremely important skill. That's why CSS 370, Analysis and Design, is a fundamentally important course for software engineering experts.
The document below shows the many different artifacts developed for the purpose of proposing ways to improve the Canvas system used by the University
of Washington, by including a local file repository system tied to the user's Canvas account.
The document details the average users for our proposed design, elicits the user requirements, and uses different diagrams to
illustrate a complete picture of what the proposed design does.
The first part about effectively communicating our proposed design is to understand who the users are. When determining who would use an
extension like ours, we wished to know who had the most use for a local repository system for Canvas. The two main personas emerged from
this process: one of a professor, and one of a student. We detailed their different demographics, goals, and frustrations with the Canvas
system by focusing on what quality-of-life changes could be made to Canvas, and through this method of elicitation, we landed on an improved
file-sharing system tied to Canvas itself.
The second aspect to writing this document is requirements elicitation. Now that we had personas with goals and needs, we could derive what
they required from our proposed system. By using this method of determining our functions of the system, we found 18 requirements, including
a robust design to handle large files, Git functionality in order to be compatible with other online systems which many colleges already
use, and the ability to submit assignments using files directly from the repository. These main requriements stemmed other requirements for
further polished design, such as the ability to convert certain files into the correct type for an assignment submission. These requirements
need to be written in a precise way in order to derive an effective artifact which describes how the requirement will be met by the proposed design.
The third piece of communicating our design to the reader is by providing diagrams in order to visualize the design. If every process within the
proposal was presented as a step-by-step guide in plain text, it would be impossible to comprehend. This is why visual aids are a must-have when
proposing designs. Within this proposal, I worked on different artifacts such as the Product Backlog, Activity Diagrams, and Wireframes. These
artifacts would format otherwise wordy explanations into easy-to-digest passages, illustrate the process a user takes when submitting an
assignment via the proposed design, and show what the design would look like when in use.
Heavy documentation doesn't have to be an intimidating book, full of passages which take hours to read. This document shows how different kinds
of Writing and Communication, when used elegantly, can effectively describe an entire software design without taking up as much space on paper.
Visual Representations of Problems and Data
Data Science is all about putting the raw information into a presentable standard for the viewer. When designing game engines, like the one which
my team and I worked on for CSS 452: Game Engine Development, this principle is one
to keep in mind at all times. When the user makes an input, it affects the data in controlled ways. That needs to also be reflected in the visual
component of a game engine. For this, we needed to take three different systems of coordinates into account, plus the system we designed for our
unique funtionality. Combined with our MapGrid coordinates, the World Coordinate system, the Area being captured by the Camera, and the Viewport
which shows the data are all required parts of being able to bring our data structures to the viewers' eyes.
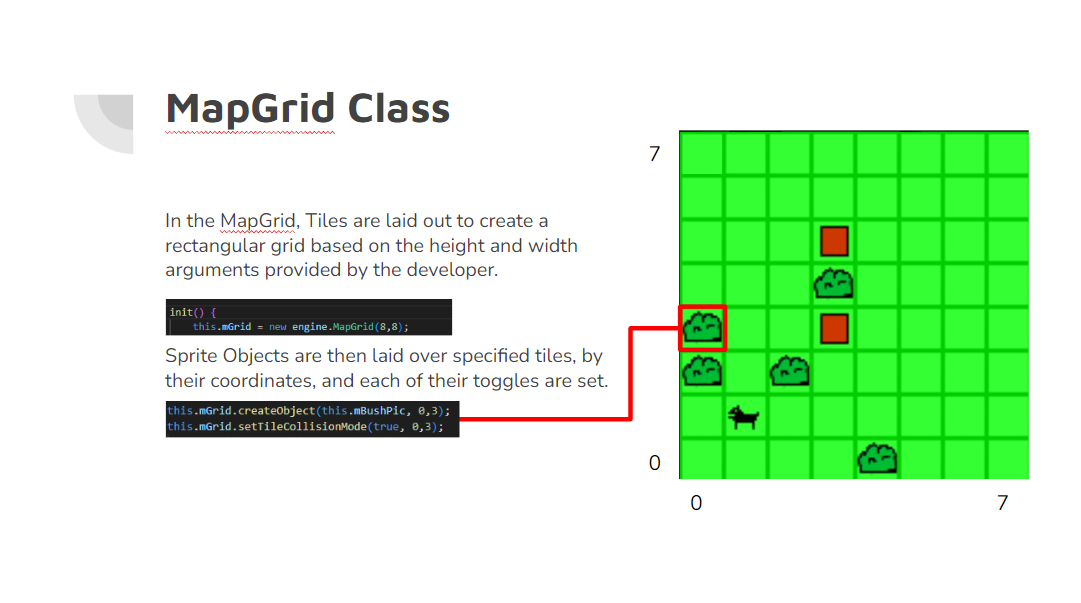
The MapGrid operates on a grid set by the amount of tiles lining its width and height. However, in order to have our Tiles alinging properly, we
also needed to understand how they would fit together on the World Coordinate space. The sizing and spacing of the Tiles is done through World
Coordinate systems.
The Camera has its own system of coordinates, similar to World Coordinates. However, objects within the Camera's frame need to be handled relative
to the Camera's origin point, which is why when placing the MapGrid on the scene being displayed, must be placed according to the Camera. In order
to properly display everything within the frame, the positioning of every object in the scene needs to be managed properly.
The Viewport Coordinate system is how we display the data being shown through the camera. It has its own system of coordinates, as just having the
camera data is not enough. The Viewport is used to bring the data involved to life, by translating the Camera's data into the data that is shown
on the screen. This is where texture, image, and color data are the most important. The Viewport translates the Camera's dimensions and translates
the width and height to its own scale, and updates each pixel with the appropriate color data on each refresh of the screen.
Visualizing Data in software is a lot more of an involved process than people expect it to be. Many different systems are used in conjunction with
each other in order to deliver the visualized data to the viewers' eyes. By creating a Game Engine with unique functionality, we ended up showing
just how controlled user input affecting data can be brought to the screen.
Addressing Real-World Qualitative Concernts
Part of the Mathematical Thinking and Visualization program requires us to work with data in order to solve actual problems in our communities.
One local institution that we worked with in the Data Visualization program was the Edmonds School District. During the course of the past school
year, the district had taken a demographic survey with different questions about parents' confidence in different aspects of their students' experience
in ESD Schools. Our repsonsibility as students in Data Visualization was to clean up the data, analyze a specific variable, and present our findings to
a representative from the Edmonds School District.
Our first task was to comb through the reponses in order to group similar entries to each necessary question, such as "What language do you speak at home?"
and "What services has your student received?", to make the data usable. For languages spoken, we grouped the responses by a those who spoke only English,
those who were bilingual with English, and those who did not. For languages other than English, we took a selection of common languages, such as Amharic,
Arabic, ASL, Korean, Spanish, and Vietnamese and gave them their own categories in the responses. Languages not common with the responses were grouped into
a single category. Similar groupings were made for Student-Assisting Services.
Secondly, we were tasked with analyzing a unique variable from the different questions that parents had responded to. My personal variable was the confidence
in the household's connection with other families in the school district. I made multiple views of this variable. First, I wanted to see how the overall responses
would be distributed, so the first graph is a simple bar graph showing the percentage of responses for each option. The next view I wished to examine was the trend
of connection between families over time, which I created different graphs to represent. The first set of graphs was connection by school, where I would look at the
schools with the most amount of positive answers, and compare those results to the schools with the most amount of negative answers. Comparing the top 5 of each, the
elementary schools seemed to have the highest level of connection between families, while high schools had the lowest level. To further support this, I also created
graphs of the positive and negative responses by Grade Level. For positive responses, the trend takes a sharp decline between the sixth and seventh grades. The distribution
for negative responses is a lot more consistent, with a short increase in dissatisfaction in connection at the 7th grade.
Finally, we were to present our findings to a representative of the Edmonds School District, Dr. Sally Guzman. Our work in Tableau was provided to her, as this data
could possibly impact actual policy and spark further research into different aspects. The most critical part of presenting our findings was the takeaways we would
find as part of our research. For my findings, one of the main takeaways was the possibility that the COVID-19 Pandemic had severely affected connections between
families. The other main takeaway from my findings was that non-English Speaking households tended to trend more towards positive responses than English-speaking households.
One explanation for this is that immigrant communities are more closely knit together, as they can come together on multiple cultural facets. Presenting the data to Dr.
Guzman was a fulfilling experience, as the full ten weeks of work culminated in many takeaways like mine being found.